Every year, our MDR and Incident Response teams produce analytical reports summarizing the statistics of security incidents of the previous year. Similar reports for 2025 will be published soon.
Meanwile, we can already share some insights based on that data. For example, our SOC expert Sergey Soldatov decided to look at how different types of high-criticality incidents (social engineering, human-driven attacks, malware attacks) were distributed across industries in different years (2020-2025).
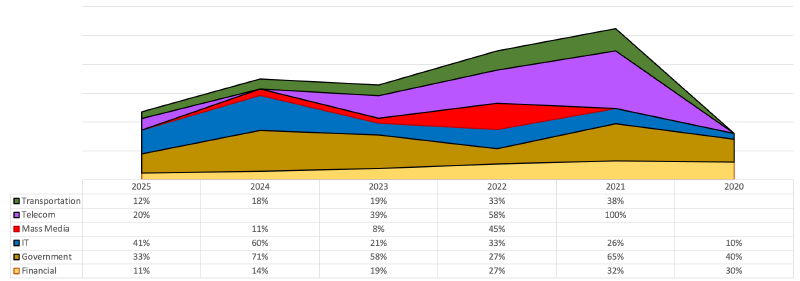
In particular, the diagram above shows the number of human-driven attacks in different sectors. You can notice a surge in such attacks on the Government sector and Telecoms in 2021. And in 2022, the Media suffered significantly — despite the fact that in 2020 and 2021, there was no interest in the Media from attackers.
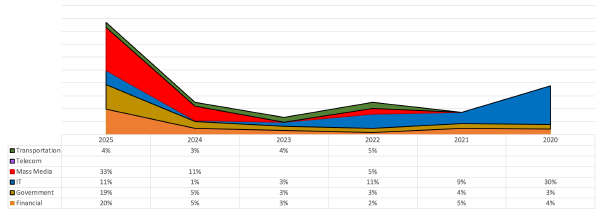
However, it should be noted again that this chart only reflects one type of attack — but there are others. For example, in 2025, the number of critical incidents of the “social engineering” type increased significantly in industries such as Media, Government, and Finance. And since successful phishing is usually followed by more destructive types of attacks, we get a very unfavorable forecast for these industries.
For more details on the distribution of critical incidents by industry, as well as hypotheses about why they are distributed in this way, see the article “The History of Critical Incidents”.